
This method returns a business analytics report for a supplier company or person.
The report is calculated from the jobs that were assigned to the supplier and includes:
-
Total job volume and monthly volume
-
Total editing actions (translated or revised segments, post edits etc.)
-
Statistics on response time, delivery in time, ratings and metrics etc.
-
Clients, managers and other suppliers for or with which the supplier worked (team setups)
This information is identical to what you can see in Wordbee Translator: Navigate to a supplier's company page or an inhouse worker's page and click the "Statistics" tab.
Note: For this method to work you need to have a subscription for the Business Analytics component.
URL
(GET) /ba/suppliers/{cid}/{uid}
PARAMETERS
The URL parameters are:
|
cid |
Company for which to return data. This parameter is mandatory. The ID can be the platform company (My Company). |
int, Mandatory |
|
uid |
Optionally restricts data to a specific user within the company. |
int?, Optional |
|
Jobs filter (optional): |
||
|
task |
Delimit report to jobs of this specific task type. For example: "TR", "RV"... If not set then data for jobs of any kind are loaded. |
string?, Optional |
|
sloc |
Delimit report to jobs with this source locale. |
string?, Optional |
|
tloc |
Delimit report to jobs with this target locale. |
string?, Optional |
|
manager |
Delimit report to jobs to projects managed by this user. |
int?, Optional |
|
client |
Delimit report to projects (and their jobs) where the client company is this ID. |
int?, Optional |
|
Date range filter (optional): |
||
|
year |
Aggregate analytical data starting with this year (2016, 2017....). If not specified then set to the current year. |
int?, Optional |
|
month |
Aggregate analytical data starting with this month of the year (1, 2...12). If not specified then set to 1. |
int?, Optional |
|
yearto |
Aggregate analytical data up to and including this year (2016, 2017....). If not specified then same as "year". |
int?, Optional |
|
monthto |
Aggregate analytical data up to and including this month of the year (1, 2...12). If not specified then same as "month". |
int?, Optional |
Examples:
Get data for the current year (January to current month) and company 12344:
/ba/suppliers/12344
Get data for March to April 2017 and person 223 of company 12344:
/ba/suppliers/12344/223?year=2017&month=3&monthto=4
RESULTS
A JSON with these properties:
|
strings |
Object that contains names of companies, persons and task codes that are referenced by this report. We include this purely for convenience so that you do not need to issue more calls to get the names. Properties:
|
object |
|
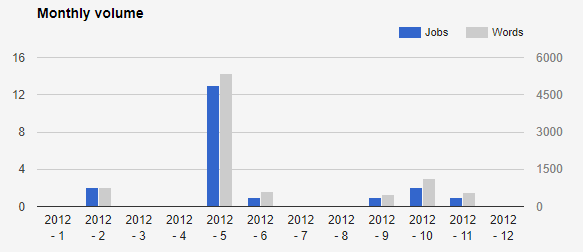
volume |
Contains work volume information with totals and individually for each type of job and month:
How monthly volume can be rendered: |
object |
|
actions |
Provides information on the total changes done in segments. Example: If user A edits a segment, which is then edited by B and again edited by A. We count 3 actions for supplier: 1 translation action, 1 corrected, 1 revision. We count 2 actions for A: 1 revision, 1 corrected.
|
|
|
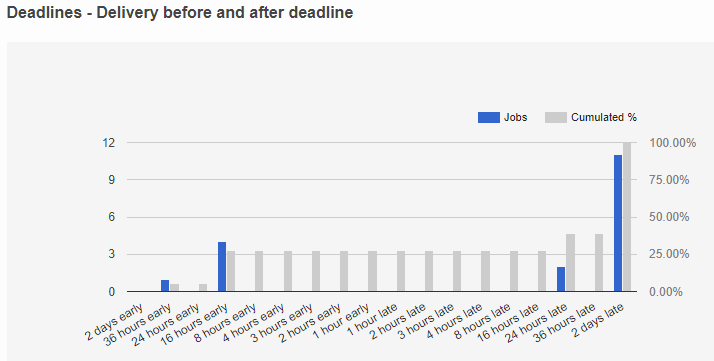
histo |
Provides histograms for detailed analysis of supplier response times (time from reception of job to acceptance of job), respect of deadlines: Histograms are stored in these properties:
In addition you find:
Each histogram is an object with these properties:
Example histogram:
|
|
|
workers |
If the BA report is generated for "My company" you will find the list of all inhouse workers. Each array element has these properties:
|
|
|
managers |
List of all project managers involved with the jobs. Same structure as workers above. |
|
|
clients |
List of all client companies involved with the jobs. Same structure as workers above. |
|
|
languages |
Volume per language couple. An array with objects:
|
|
|
team |
Information on other companies or workers with which the present supplier was involved in workflows. An array with objects:
|
|
|
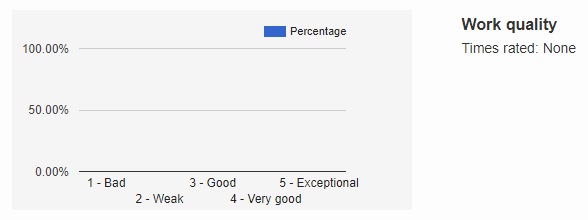
ratings |
Ratings given to the jobs of the supplier, either by the supplier himself or his manager. A rating is a value between 1 (worst) and 5 (best). There are zero, one or more categories that can be rated. The categories are configured in the Wordbee Translator platform.
Each of these two objects has these properties:
Each histogram has these properties:
Example:
This is how a histogram could be rendered (no ratings done here):
|

SCOPE OF DATA
Supplier data in this report is provided by the Wordbee Translator BA component:
-
Live data is aggregated per calendar day with a lag of 3 to 4 days. Thus you will not see any data later than 3 to 4 days ago.
-
The report comprises completed jobs only.
EXAMPLE
Sample results for an external supplier company:
Example - ba/suppliers/{cid}/{uid}