
Business Analytics is an optional module of Wordbee Translator. If it is not enabled please contact sales.
This page introduces how to access and use business analytics reports.
Open business analytics
Hover the My Company top navigation menu and select Business Analytics.
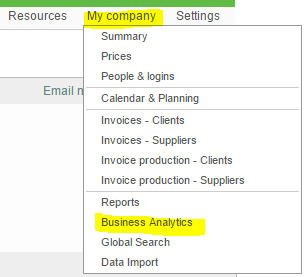
The business analytics page opens:
Note: The very first time you access the tool, you will be asked to activate the feature. It then takes 3 to 4 days until sufficient data is aggregated and the reports become accessible.
Select a reports
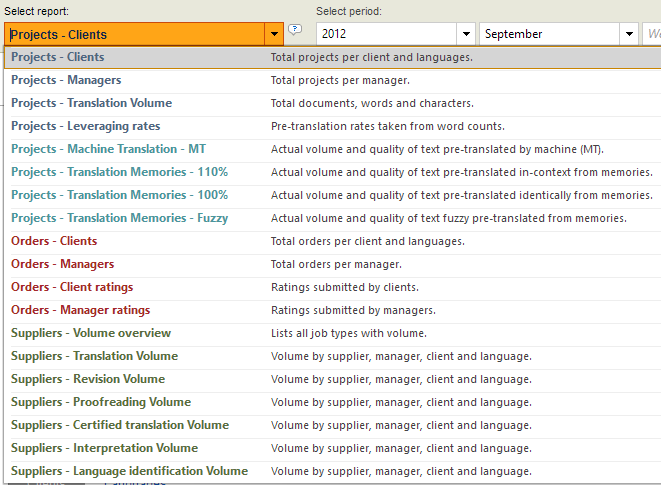
Choose a report in the first pick list:
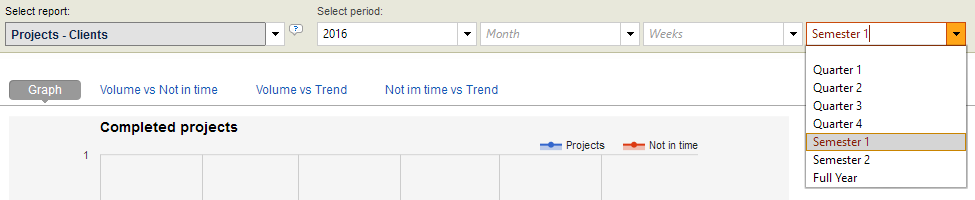
Choose your date range
A specific month:

A specific range of 10 weeks:

A specific quarter, semester or full year:
Navigation, filters and drill down
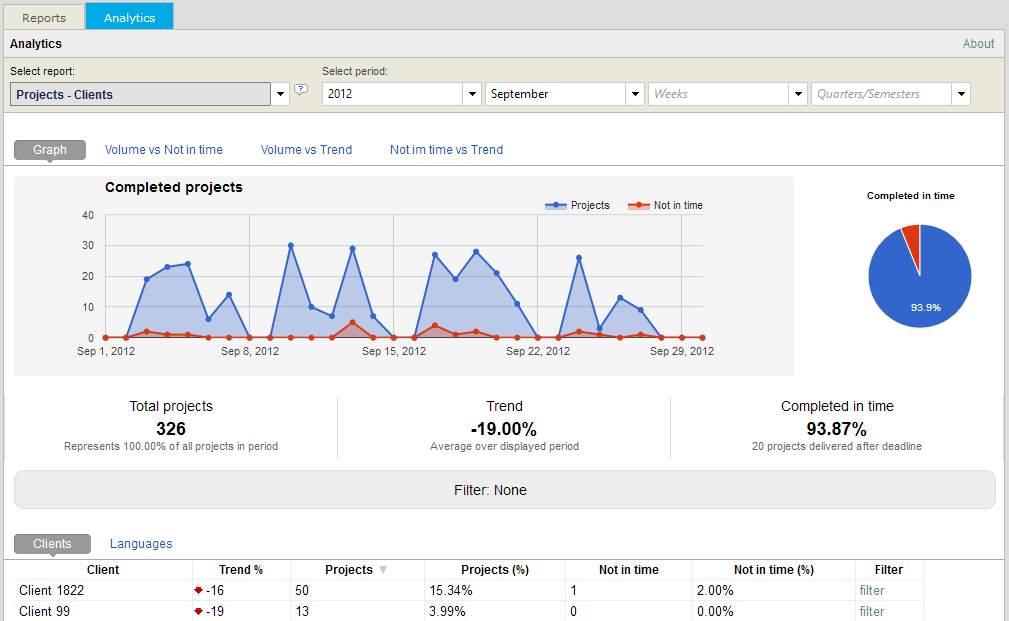
Each report is different but they all share common navigation and filtering elements. We will look at the "Projects - Clients" report to highlight the most important options.
-
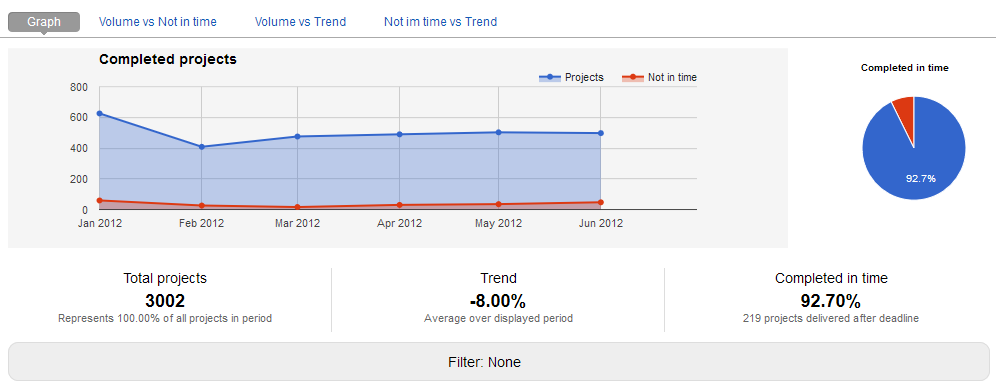
The chart shows the total of projects completed in the selected date range (blue line). The red line is the amount of those completed projects that were not completed within the project deadline.
-
Below the chart you see the total. The Trend tells whether there are more or less projects at the end of the period compared to the start. The trend is calculated by fitting a straight line.
-
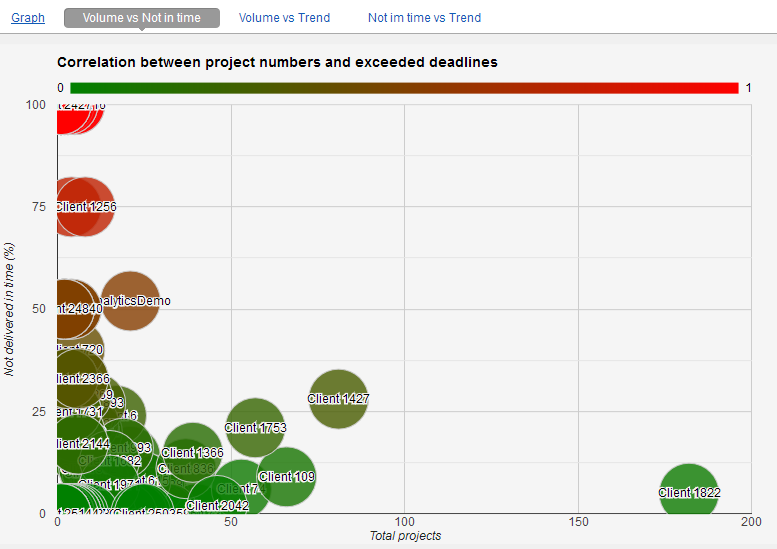
Above the chart you see tabs. They typically highlight specific aspects of the data. Below we can see if there is a relationship between size of project and respect of deadline:
In the bottom part you will find tabular information. In our report we have the list of clients, each with total projects and volume trends (i.e. do we do more and more work for the client over time?).
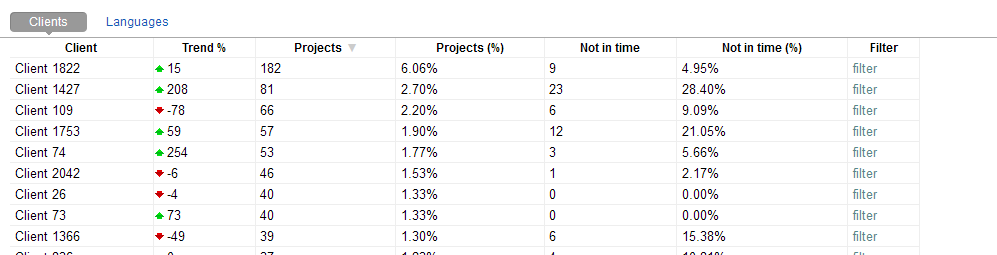
Note that there are usually multiple tabs depending on the report. Above you can also look at project information per language couple.
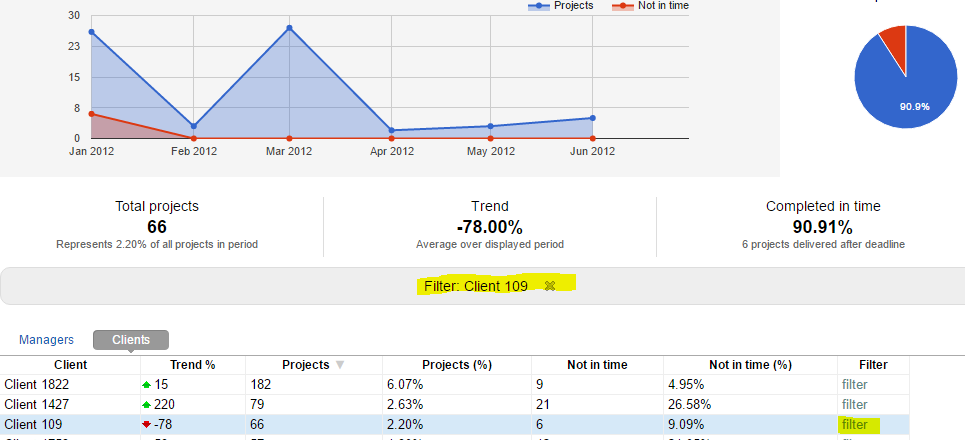
The filter link next to each client applies to the chart in the top:
How does it work?
Once per day, all events of a 24 hour time window and approximately 3 days earlier in the past are loaded, prepared and aggregated. The aggregated information simply is a summary of 24 hours of events. It is saved to a specific database used to generate the business analytics reports.
For example, in the report described above, aggregation retrieves all projects that were completed in a 24 hour window. During aggregation, the system retrieves client information, deadlines and all other data needed in the report. Since BA aggregates data from three days earlier, you cannot see the most recent data such as completed projects of today.
How does it compare to Business Reports?
How does it compare to Business Reports? Business reports show data from your live database including the most current one. Business Analytics is here to drill into historical data and to see trends.
First time users and activation
When you access the business analytics page the very first time, you will be prompted to activate the component. Do so by choosing your time zone, which defines the 24 hour window of aggregation.
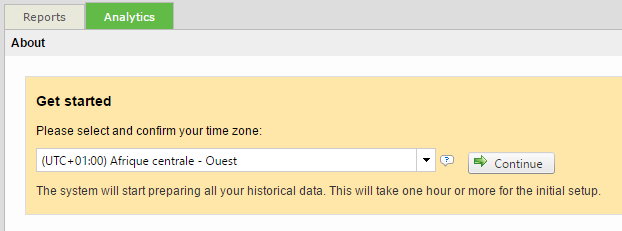
Once activated you need to wait some time until your historical data has been preparted.
However, if your Wordbee platform was just created then you will need to wait 3 to 4 days until you can view reports (BA shows historical data starting at 3 days into the past).