
Please carefully read this page before you start creating your reports.
Introduction
Once you have created a new report, you can start with customizing the report template. A report template simply is a regular Excel file with extension ".xls" (.xlsx files are not supported). The template contains "placeholders" which will be filled in with the data when you create the report.
The screenshot below shows the template of report S100 - Client and supplier costs - Details:
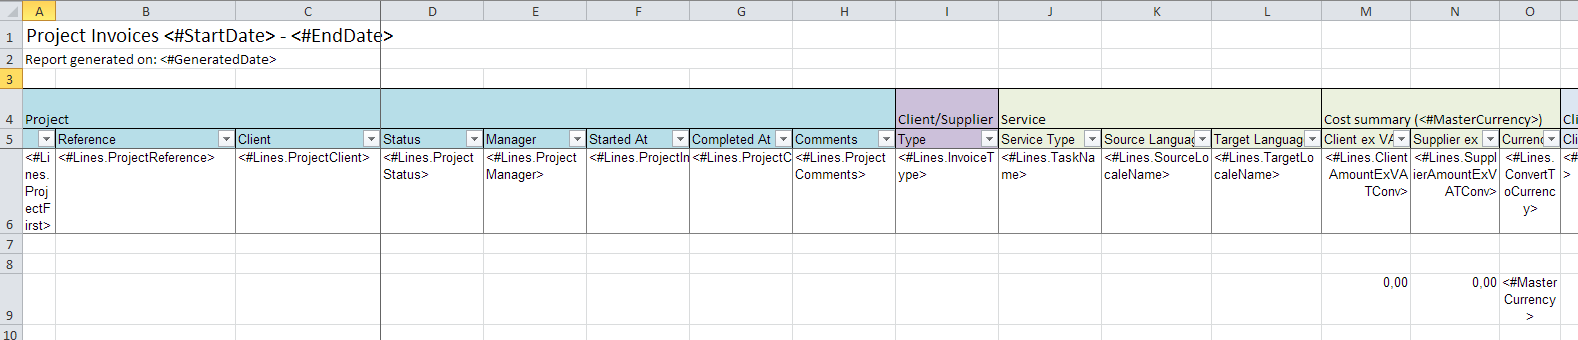
<#GeneratedDate> will be replaced by the date when the report is created.
Global placeholders
Global placeholders such as <#GeneratedDate> can be placed in any Excel cell in any sheet. Each report proposes a few general placeholders.
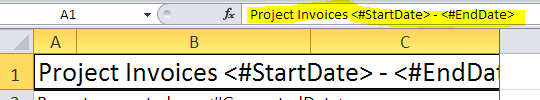
Most reports show the date range that was selected when creating a report. This uses two global placeholders:
Data row placeholders
These are the most important placeholders. Each report contains data rows such as a list of projects, a list of jobs, a list of invoices, etc.
Each template contains a special Excel row with data row placeholders. The row is then repeated per each line of data when you create the report.
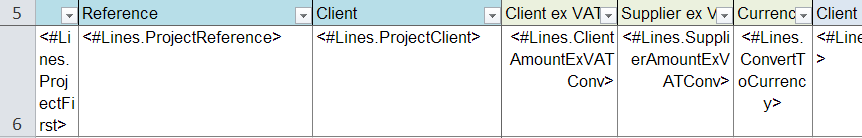
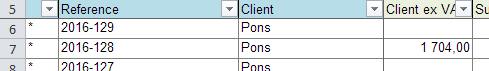
In each printed row, <#Lines.ProjectReference> is then replaced by the project reference:
The Excel row where row placeholders can be placed is defined by an Excel table range named ___Lines___ (3 trailing and leading underscore characters),
Wordbee reports generally use this range name unless otherwise specified. Data row placeholders include the range in which they must be placed. This is why the project reference placeholder is <#Lines.ProjectReference>.
Note: In some reports the range may be suffixed such as in ___Lines___X but that suffix is disregarded and can be changed.
Available placeholders
Creating a new report starts with cloning an existing default report.
Go to the documentation of the default reports to know which placeholders you can use.
Data row table range
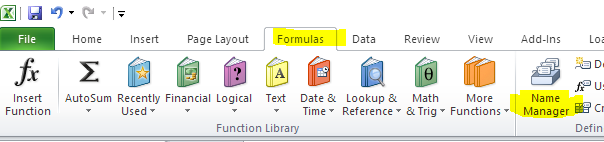
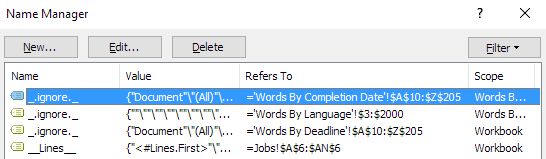
The ___Lines___ table range can be edited. In Excel, click the Formulas ribbon and then the Name Manager button:
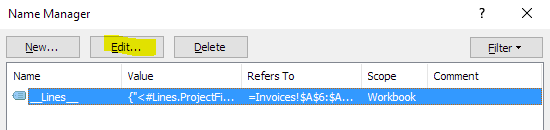
The list of ranges is shown and can be changed if needed:
Multiple Sheets
Your report template can contain any number of sheets. Often, this is useful if you want to add charts or pivot tables.
One of the sheets, not necessarily the first one, must contain the raw data and the ___Lines___ table range. Charts and pivot tables are then build from that raw data.
Pivot tables and charts
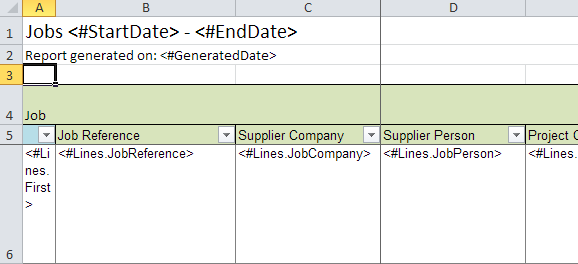
Report "S420 View - Jobs Volume" is an example of how pivot tables are created. Lets look at all the sheets in the template. The first 3 are pivot tables, the 4th ("Jobs") contains the raw data with the ___Lines___ range. Hence, the pivot tables all get their data from the 4th sheet.

This is how the "Jobs" sheet containing the raw data looks like:
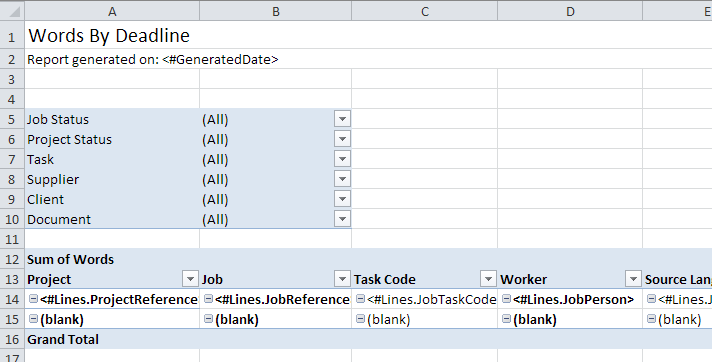
This is how the first sheet with its pivot table looks like:
How you create and customize pivot tables or charts is beyond the scope of this page. You can find tutorials in the Internet.
In order for pivot tables or charts to work, you must enclose it in a table range named exactly "_.ignore._" In the Excel Table Manager explained earlier, you can see three "_.ignore._" ranges defined, one per each of the 3 pivot tables of the template:
The purpose of the "_.ignore._" range is to prevent that the report generator attempts to disregard any occurrences of "<#....>" in the sheet. If you omit doing this, your report will fail to create.
Data cell formatting
A lot of care should be given to properly formatting cells:
-
Assign the correct cell format: Is it a number? How many decimal positions? Is it a date? etc.
-
Wrap or do not wrap cell content: Wrapping content ensures that text in a cell does not overrun the one to the right.
-
Align left/right and top/bottom.
Check out the default report templates to find out how these little but important details are configured.
Formulas
Report templates allow unlimited use of all Excel features including formulas.
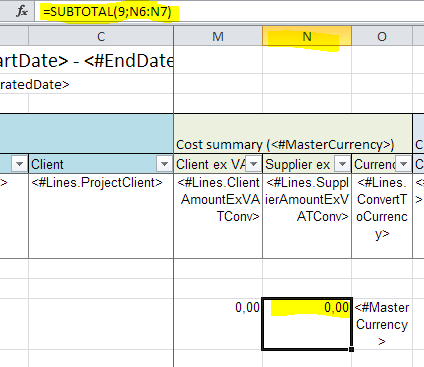
For example, for the sum of a numeric column insert the Excel SUBTOTAL function. Below this is the sum of an invoice total converted into your currency. Therefore, we put <#MasterCurrency> into the cell to the right. Always use SUBTOTAL instead of SUM. In fact, SUBTOTAL shows the sum of filtered rows, whereas SUM will show the sum of all rows notwithstanding an applied filter.
You can create formulas in the data row that operate on placeholders such as =<#Characters>/250 to obtain an estimate of pages.
Before you save your template
Select the first sheet and a default cell when saving the template.
The reason is: Excel will open the report with the last selected sheet and cell being highlighted.