
The Statistics panel gives you a live overview of where a job, project, or translation memory stands for a chosen language, and lets you jump straight to the segments behind any number.
Opening the panel
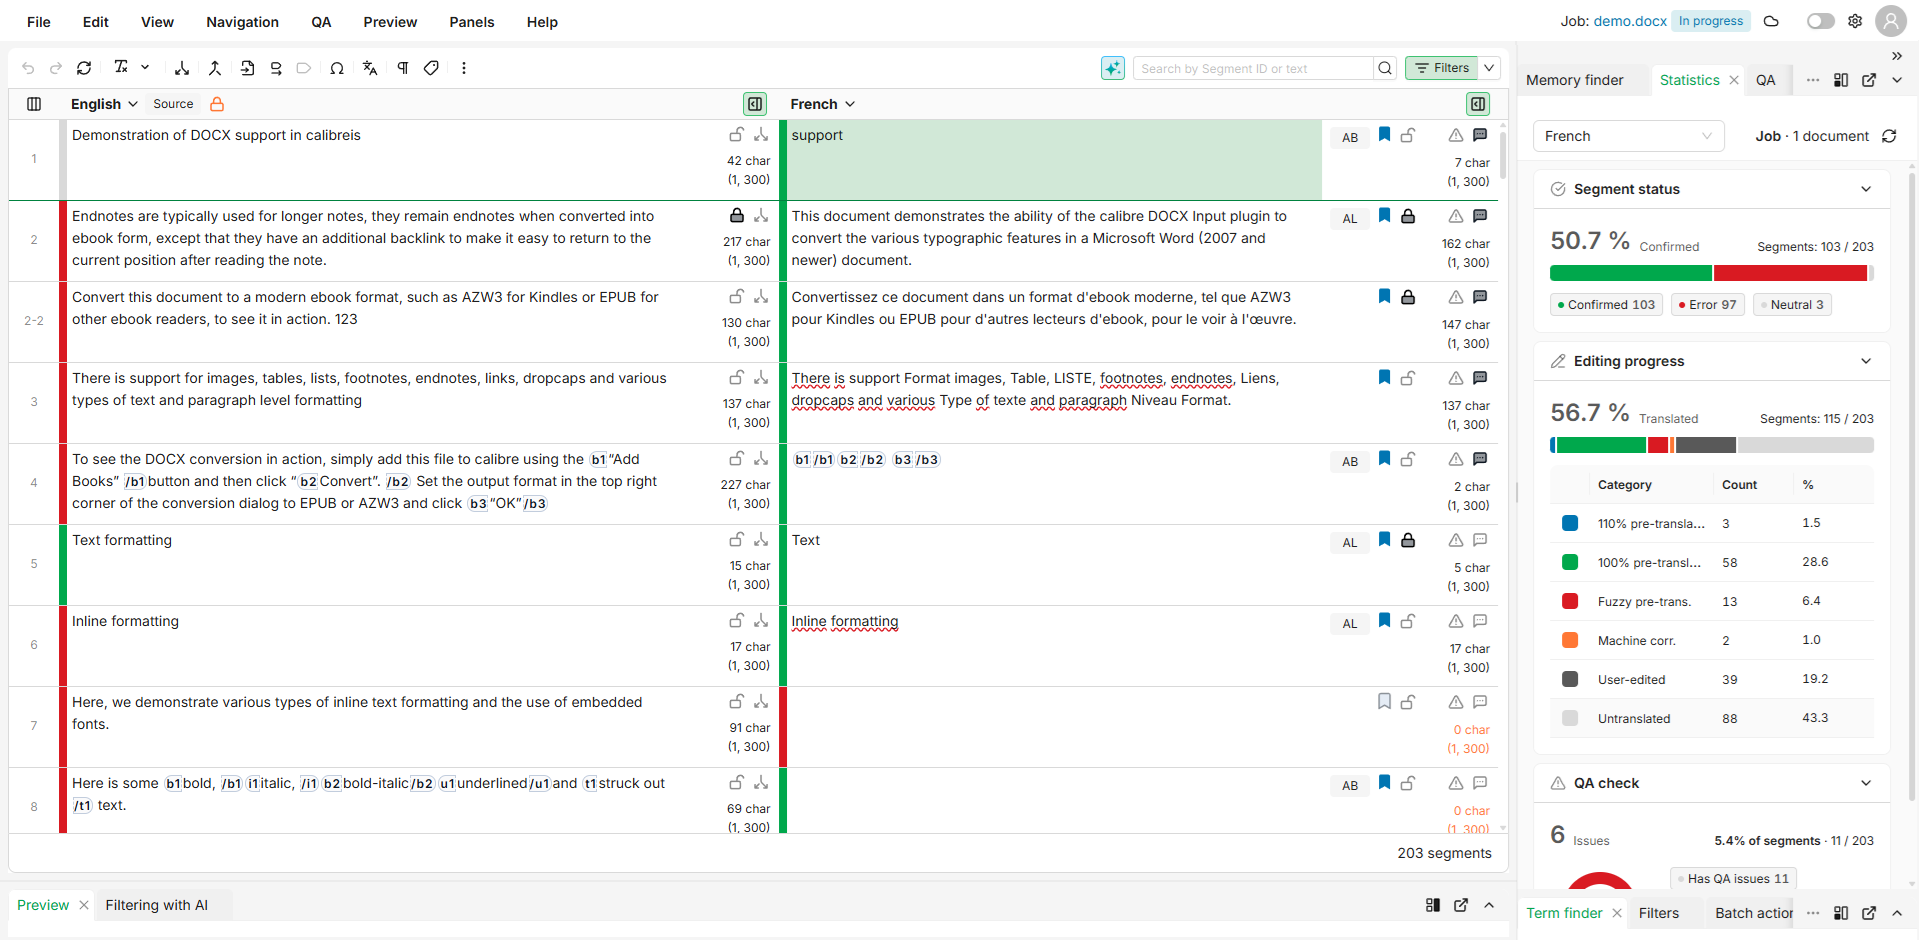
Open the Statistics panel from the Editor sidebar. The panel always shows the numbers for one language at a time.
Choosing a language
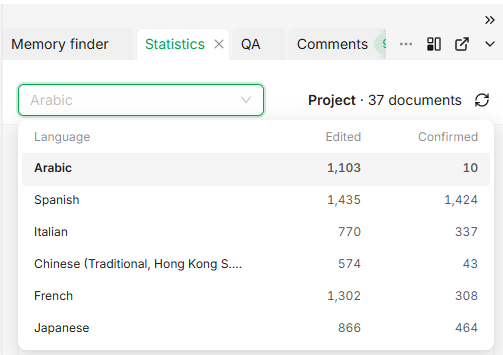
Depending on your permissions, users may have access to the statistics for other languages. Use the language selector at the top of the panel to choose which language the figures apply to.
The selector lists every language your permissions let you view, whether or not it is loaded in the grid, and shows each one's edited and confirmed totals next to its name. A language you may view but not edit carries a read-only lock.
Reading the statistics
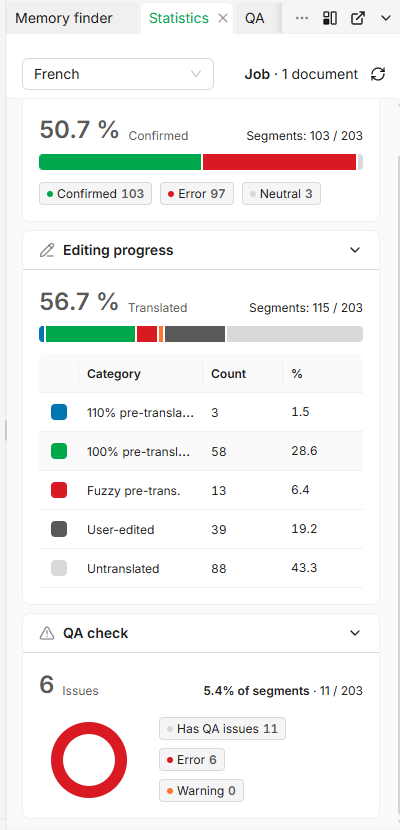
The panel groups the numbers into sections, each covering the selected language:
|
Section |
What it shows |
|---|---|
|
Segment status |
How many segments are confirmed (green), in error (red), or neutral (no status set). |
|
Editing progress |
How much of the content has been translated and edited, and how much is still untranslated. |
|
QA |
How many segments still have QA issues. |
The figures cover the whole scope, not only the document you have open: for a project, every document it contains, as stated in the panel header (for example Project · 37 documents). Opening a different document does not change them.
Filtering the grid from the panel
Every value in the panel is clickable, so you can move from a number straight to the segments behind it.
Follow these steps to filter the grid from the panel:
-
Open the Statistics panel and select the language you want to review.
-
Select a value or category, for example the segments with QA issues or the segments still untranslated.
-
The grid filters to show only those segments, so you can work through them directly.
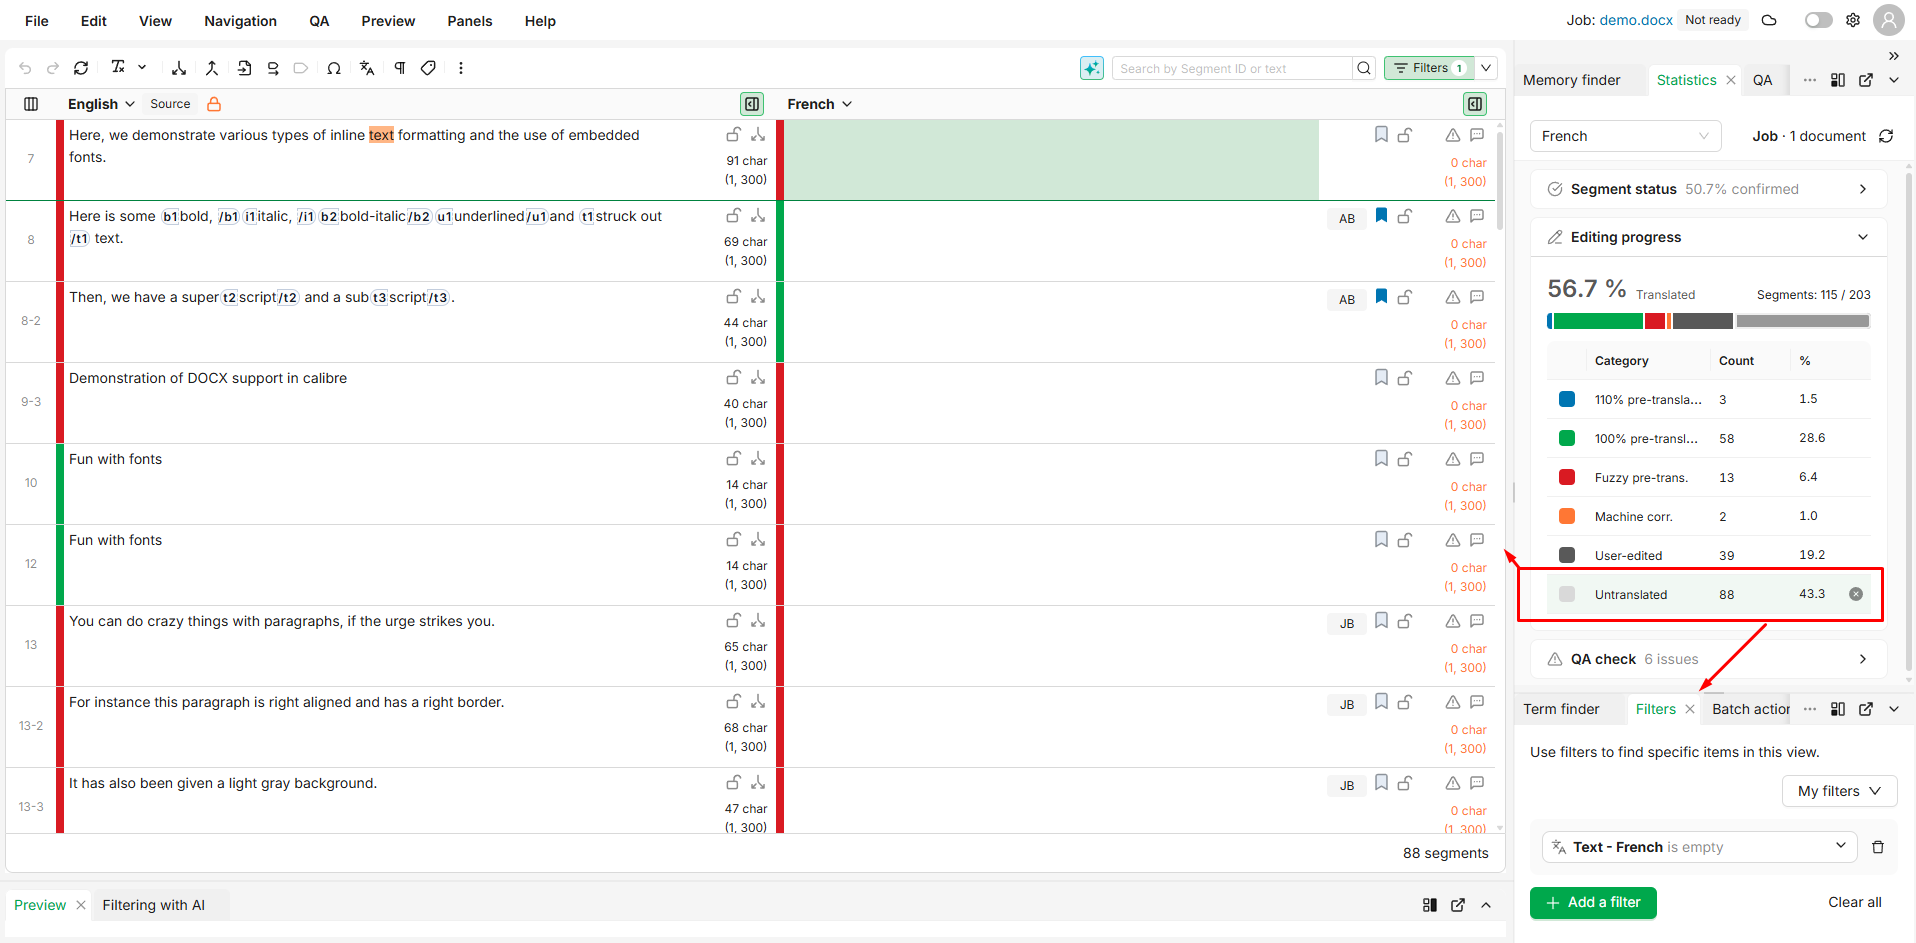
Use the panel to jump to the exact segments that still need attention, then clear the filter to return to the full document.
You can only filter by a language that is loaded in the grid. When the selected language is not loaded, its figures are still shown in full, but the values are no longer clickable: hovering over one tells you what to do, for example Add German to the grid to filter by it.
A filter that is already active on a language stays visible and can still be cleared, even if that language is not loaded in the grid.
Two signals that are easy to mix up:
-
A lock next to a language name: you can view that language but not edit it.
-
Greyed-out values: that language is not loaded in the grid.
One does not imply the other: you can have full editing rights on a language and still not be able to filter by it, because it is not in the grid.
Statistics and the Job Status
When per-job status is enabled, the panel counts translated segments based on the Job Status specific to the job you are working in, matching the status shown on the translation cells. This means the figures reflect your own job rather than the shared, project-wide status.